Tuesday, July 16, 2013

Location Decisions: Homing in on Alachua County

This week we learned about using the Weighted Analysis tool to help in decision making by ranking specific attributes and then "weighing" them against one another.  Map 1 is just a basic basemap of Alachua County, Florida.
Map 1

Map 2 is the setup for the weighted analysis.  Each of the four criteria are ranked and converted to a raster file.
Map 2

Map 3 is the results of our weighted analysis.  The left map was created using equal weights for each of the criteria.  In the right map, the weights were altered giving more priority to the distances from NFRMC and UF.

Map 3

Wednesday, July 10, 2013

Urban Planning: GIS for Local Government

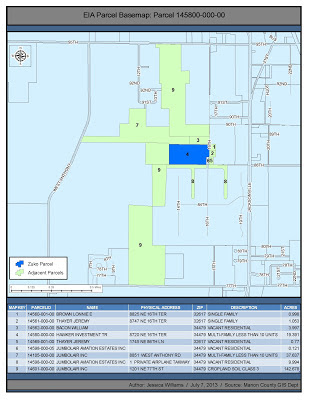
Environmental Impact Analysis map

Scenario 1: Zuko Parcel

Scenario 2: Vacant county property selection

Saturday, July 6, 2013

Urban Planning: Parcel Assessment Pt2

Q5: Which accounts do you think need review based on land value and what you've learned about assessment?
Odd shaped parcels are undevelopable parcels and therefore would not need review.  As the majority of parcels fall into the value of $27,075, any value outside of that should be considered for review.  A number of factors, like slope, vegetation, or watershed, could cause the property value to vary.  Being it is Florida, slope may not be much of a consideration, however the further north one goes, this could certainly be a factor.  Vegetation and watershed would be major considerations in Florida land assessments however.


Urban Planning:Parcel Assessment Pt1

Q1: Does your property appraiser offer a web mapping site? If so, what is the web address? If not, what is the method in which you may obtain the data?
Yes.  http://www.cowetatax.com/.  I used this site almost daily prior to our GPS collection project to determine tax districts and parcel lines.

Q2: What was the selling price of this property? What was the previous selling price of this property (if applicable)? Take a screen shot of the description provided to include with this answer.
 The records for all of 2013 do not show pricing.  The month of June showed zero sales and the page indicates that it was last updated on June 21, 2013.  The first month with pricing data was December 2012.  The highest property sold was a newly constructed assisted living facility for $20,018,200.  The property previously sold for $884,750, in 2008.

Q3: What is the assessed land value? Based on land record data, is the assessed land value higher or lower than the last sale price? Include a screen shot.
The current assessed land value is $878,706. This value is ~$14,000 less than the previous sale value of $884,750, in 2008.

Q4: Share additional information about this piece of land that you find interesting. Many times, a link to the deed will be available providing more insight to the sale.
No link to the deed was available, but I found it interesting that the total values (land, improvement, & accessory) totaled $4,607,405.00, yet the sale value was $20,018,200.  


Homeland Security: Protect

On April 15, 2013 the 117th running of the Boston Marathon took place in Boston Massachusetts. The race started like any other, but the ending of the race was cut short by two explosions that took place near the finish line a couple of hours after the winners had crossed.  The two explosions killed three and wounded hundreds of race participants and spectators.  Many interviews after the fact attested to the fact that the city of Boston had planned and prepared for disasters.  The close proximity of many area hospitals, no doubt saved many lives.  The location of the then closest facilities are shown in Map 1.

Map 1

How the two suspects, Chechen immigrant brothers, Dzhokhar and Tamerlan Tsarnaev, were able to place the pressure cooker bombs unnoticed remains unclear.  What is known that bag checks were not conducted near the finish line.  Using Esri selection tools, Boston PD and race organizers can determine the best places to place security check points for future events.  Map 2 shows a 500 ft buffer around the finish line and the points where that buffer intersects with local roads.


Map 2

Also critical to any surveillance operation is line of sight observation.  Esri 3D Analyst extension allows the user to create line of sight visuals that can aid in the placement of roof top and street level observation points. The hillshade tool can be used in conjunction with the U.S. Naval Observatory Astronomical Applications Department to determine where shadows and non-visible areas may occur throughout the day.  Using the Sun or Moon Altitude/Azimuth Table, planners can find the azimuth and altitude of the sun at a particular time of day to create a model of shaded areas.  This model can then be used to determine what areas are visible form selected surveillance point.  Furthermore, the line of sight tool can be used to determine exactly which areas of a line of sight are obstructed.  These three elements are depicted in Map 3.

Map 3