Wednesday, August 6, 2014

Sharing Tools and Final Thoughts

Sharing Tools
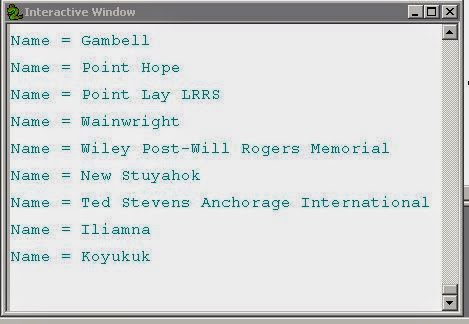
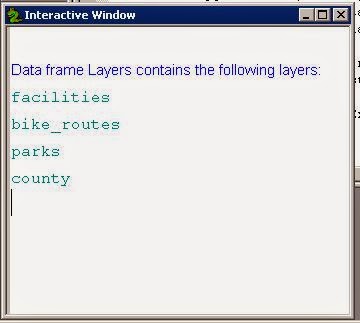
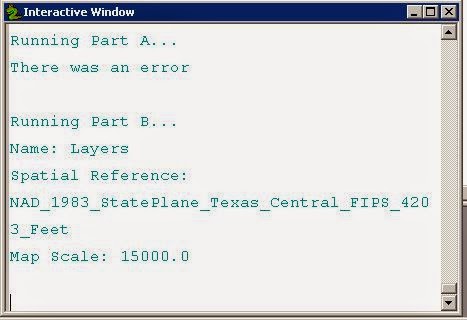
Last week and in a previous week, we shared tools that we created by adding the toolbox and the script to a zip file and sharing in this manner. This week we learned that this can be simplified into just one file by embedding the script into the script tool.  This is helpful when you want to share with the not so savvy user by reducing steps needed for using the script and for sharing with the they think they are savvy user and password protecting the script so that they can't get in there an fiddle with your code.  The script tool that we created included a prewritten script that only needed slight modification for embedding purposes.  The tool was used to select 6 parameters that selected a random number of points, within a certain distance of one another and created a buffer around each point.  These are my results.

Script tool dialog box and results


Final Thoughts
What is the most memorable, interesting or useful things I learned about using Python with ArcGIS during the course?  Hmm, let me think.  I learned that programming, in general, can be useful for repetitive, complex, lengthy tasks.  I have learned that I don’t think Python is as easy to learn as they say it is, and therefore doubt I will try to pick up any other additional programming languages.  But I have also learned that for every one person who gets and understands programming, there are thousands that benefit from it.  Where would any of us be without the programming pioneers of the early PC days?  We would probably still be hand drawing maps and shuffling through mounds of paper data trying to analyze it all.  Not everyone is cut out for everything, and that’s OK, it’s what makes this world work.  We each have our strengths and our weaknesses.  But when we identify our weakness and strive to make them strengths, that’s when we excel, that’s we step ahead of the next guy, that’s where we become a part of something bigger than us.  

To sum up this class, I have come to the realization that I do not have a programmer’s brain.  I have no idea how you guys remember all the things that go into modules and functions and command and syntax.  Maybe back in the day, when my brain hadn't lost quite so many cells, I would have had an easier time with this.  I hope one day maybe to retain just enough to keep me guessing on what I can do with Python. I definitely have a use for it at work.  Thanks for the instruction along the way.

Friday, August 1, 2014

Creating interdisciplinary collaboration through Python script tools

Landscape genetics is an area of research that combines population genetics, landscape ecology, and spatial analysis to understand the effects of landscape composition, configuration and matrix quality on gene flow and spatial genetic variation.  Knowledge of these areas typically requires more than one discipline of study so it makes sense that interdepartmental collaboration would be necessary.   The author, Thomas R. Etherington, identifies this area of concern, and using his knowledge of Python programming and ArcMap was able to create thirteen script tools for use by his colleagues that simplified basic, repetitive and complex processes.   Through use of script tools created and stored in an ArcMap toolbox, the author made it possible for non-GIS specialist to access the tools through a much simpler to understand GUI interface.  The author also recognizes that through script tools, geoprocessing and analysis can be combined for larger workflows.  While not specifically mentioned he is most likely referring to ModelBuilder.  Another point the author expands on is that since the scripts are created in Python, which is an open source language, they are easily accessible for other developers to use and modify to fit their own specific needs.


Python based GIS tools for landscape genetics: visualizing genetic relatedness and measuring landscape connectivity, Thomas R. Etherington, pages 52–55Methods in Ecology and Evolution, January 2011, Volume 2, Issue 1

Creating Custom Tools

Say you have a script that you want to share with other users.  This script can be sent to another user and they can run the script.  But what if that script needs to have a variable parameter.  In a stand-alone script, the user would have to edit the script file and have some knowledge Python.  Wouldn't it be better to create a GUI tool that the end user could easily pull up in ArcMap and change those variables without having to know Python?  Creating a custom tool can do just that.  Many times users of ArcMap are not always well versed of the ins and outs of GIS, geoprocessing or Python programming.  A custom tool can be configured to choose specific parameters and perform functions detailed in the associated script.  A custom tool can be used in ModelBuilder to manipulate geoprocessing functions whereas a stand-alone script cannot. Additionally, print messages in a stand-alone script are only visible in an interactive window.  With a custom tool, print commands can be viewed in the Results window.

Our assignment this week was to create a custom tool based on a given script.  First we needed to create the toolbox and a script to it.  Then we associated a script file to the tool.  Parameters must be defined in the tool that correspond to the parameters in the associated script.  Once the parameters are established, clicking on the script tool will produce the following screen.

Script tool with established parameters

 A stand-alone script cannot run certain commands within a script tool.  For example, a simple print command such as print "Clipping", inname.name, must be modified to properly run in the script tool.  The arcpy.AddMessage function takes the place of the print command and commas are replaced with the plus symbol.  As you can see in the results below, printed messages can be viewed in the results window of a script tool.

Viewed messages in the Results window

Friday, July 25, 2014

Module 9: Debugging and Errors

Errors are an inevitable part of scripting.  It's not a matter of if they will happen, but when and where.  Knowing how to find the when and where is a vital part of scripting.  Syntax errors, exceptions, and logic errors are all possible types of errors. There are a number of ways to find where errors exists.  The PythonWin toolbar is a good place to start.  It can tell you if a an error occurred and on what line.  The debugger tool in PythonWin is also another useful tool in finding errors.  Being able to step through lines of code one at a time can pinpoint the location that a script stops working.  Commenting out lines of code and adding print statements are also helpful in finding errors.  Lastly, the try-except tool can be used to allow a script to run even if specific sections of code contain an error.

This weeks assignment was to locate script errors and correct them and to use the try-except command to show how a script can run even with an error present.

The first script contained two errors that needed to be found and fixed to display the names of the airports from module 6 data.
Script1_Results

The second script contained 8 errors that needed to be corrected.  I was able to locate the errors by using selective commenting and interpreting the interactive window results.

Script2_Results

The third script contained an error, but instead of fixing the error, we were to insert a try-except command that would allow the script to run even though there was an error in part A.

Script3_Results

Friday, July 18, 2014

Working with Rasters

Raster files are images that are used in ArcMap.  They can come from a variety of sources and formats including .img, .tif, and .jpg formats to name a few.  Python can be used to describe components of a raster file, to remap and reclassify landcover, and to calculate slope and aspect.  The most commonly used extension in working with raster files is the Spatial Analyst extension.  Within Python, the arcpy.sa module is most used and all functions should be imported.

Our lab this week had us use a number of arcpy.sa functions to remap and reclassify landcover as well as calculate a desired slope and aspect of the elevation raster file.  My final result can be seen in Results1.

Results1

I actually understood most of this lab.  Not sure why this week was so much more different than the previous weeks.  I still struggle with retaining the code and its proper usage, so I spend a lot of time looking for examples.  I would love to find a way to remember some of this stuff as it would be useful in my everyday work with ArcMap.  Not so much the spatial analyst, but definitely some of the other modules and functions we have seen up to this point.

Monday, July 14, 2014

Working with Geometries

Geometries can best be described as the bits and pieces that make up a feature.  This includes everything from a point or vertices that display the feature to the attribute data that contains the information on where those points should be placed.  Features such as polylines and polygons contain an array of point geometry.

This weeks lab we were to create a text file from an existing shp file.  A for loop with a .getPart() method was used to get all parts of the line feature class.  The second column of data shows each vertex point that was used to create the polyline for each river.

Mod7 Results

I'm not of fan of programming.  I find that it's the little mistakes that are sending me headlong into a brick wall every week.  But, for some reason, walking away from it for a day or two always seems to make things more clear.

Friday, July 4, 2014

Exploring and Manipulating Spatial Data

This week, we used Python to explore and manipulate data.  I still do not think I am getting the hand of for loops.  However, I did manage to create a half working script. These are the results of my script:


Results
I'm not entirely sure what I am doing wrong.  But, it's the 4th of July and I'm off to celebrate with some fireworks.  I hope you do too.

Friday, June 20, 2014

Geoprocessing with Python

This week was a little less stressful than last week.  Having used geoprocessing tools in ArcMap, I think I had a more clear understanding of what I needed to accomplish my task.  This week we needed to create XY coordinates from an existing point feature class.  Next we needed to create a 1000 meter buffer around the points, and then dissolve that buffer.  Our script needed to print all messages from each of the geoprocessing steps.  These are the result messages as they appear when using Python in ArcMap .

Script results


I must admit, I always get a little nervous when I see someone else has taken a different route to get the desired results.  I have flashbacks to six grade algebra and the nuns at Catholic school yelling "You have to show your work!"

Monday, June 16, 2014

Python Fundamentals Part 2

What the holy hell happened!  Man o man, did I hit a wall this week.  The first few week of this course and I'm zipping through it thinking this is going to be a great summer and then week 4 happened.  I realize, that I am a visual learner.  I need to see the action in order for it to click in my head, I need to be able to dissect the working code in order to understand the ins and outs.

This week, we were given the start of a script.  The import random module was already loaded at the start of the script.  We then needed to find some errors in a block of code that would allow the scipt to run properly. Luckily, the lecture helped to clear this up.  And then step three happened.  In step three we were to create a list from scratch using 20 random numbers between 0 and 10.  I knew some of the modules that I needed to use, and individually I could run them with proper results, however, the while loop, threw me.  I had a very hard time comprehending how to include the append function and the random integer. Once I got past step 3, things seemed to move along a little better.  Once I had my list created, I needed to create a random unlucky number that would be counted and then removed from the list.  I'm not sure why this while loop was easier to understand than the last one, perhaps because I was able to dissect the previous one.  Our final results were to include the original block of code that we fixed, our created list, a statement declaring how many of the unlucky number would be removed from our list; if any, and our final list with the unlucky number removed. Below are the result of the my script.

Script results

Here's hoping my clicker works better next week.

Friday, June 13, 2014

Mapping the Herrin Massacre Potter's Field

The Herrin Massacre took place in Williamson County Illinois in 1922.  A chance meeting between a historian looking for the gravesite of a WWI vet killed in the massacre and a geospatial scientist initiated the mapping of the Herrin Massacre Potter’s Field and the entire Herrin City cemetery.   The project took approximately four years to complete, mostly because of researching the data that was not previously digitally recorded or was missing completely.  Data was input into a sql database and a custom enterprise geodatabase was created and shared through use of various services via ArcGIS for Server.  
A GIS model was created from an old hand drawn map using known dimensions.  This model was used as a template since it was just the conceptual drawing.  Using data created and recorded over the history of the cemetery, the team was able to map the routine of each of the sextons over the years to approximate the location of the potter’s field. 
Detailed typography, headstone outlines, and satellite imagery were processed in ArcGIS 3D Analyst.  This gave the team the ability to locate unmarked sites by analyzing the subtle changes in the ground surface. 
Though these combined processes, the team was able to sumise the lot in which the potter’s field was potentially located.  Their continued research and proven geographical, historical, and geospatial data was enough evidence to convince the city to allow excavation.  On Nov 12, 2013 the first vault and coffin were discovered and confirmed based on historical accounts describing the coffins and photos taken prior to burial.
What I found most interesting about this article was the use of new age technology to bring back the past.  Even though the records were missing, the team was able to analyze the available data to correctly locate burial sites that lay unnoticed for nearly 90 years.  Being able to analyze subtle difference in ground depression to find the unmarked graves could not have been accomplished using just satellite imagery or aerial photography.

Friday, June 6, 2014

Python Fundamentals Part I

This week we started compiling basic Python code. The key to understanding code is to understand the psuedocode.  For example, where do you start, what are the steps in the middle, and what should the end result be.  For our lab, the psuedocode would look like this:

  1. Create a string for your name
  2. Split that string into a list
  3. Print last name
  4. Find the length of the last name
  5. Multiple the length of the last name by 3
  6. Print length of last name times 3

This took some trial and error. As I was going along in my script, I would use the print command after each line of code to ensure that I was getting the correct response.  It took a while to wrap my head around the concept of creating the variable lastNameLen.  I had to realize that I had to tell the code what the variable lastNameLen would be equal to the last list item of my last name.  Once it clicked, the rest of the script seemed to fall into place.

The image below is the results of my script. You can see that my last name Williams is printed (step 3) and so is the number 24, which is the multiple of 8 (the number of letters in Williams) x 3.

Script Result

Friday, May 30, 2014

Geoprocessing In ArcGIS

For this weeks lab we created a geoprocessing model that was used to create a script that was used to create a tool.  The results of the model can be seen below.  Creating the model was a first a bit confusing. The instructions were very basic, however, it made me think a bit more about what I was doing to get to the desired results. Once I got in the right frame of mind, setting up the model was rather simple.  When written out it seems rather long and complicated, but it is mostly repetitive. 

The model I created was used to: 
1. Clip the Soils layer to the Basin layer
2. Select the Soils that were classified as "Not Prime Farmland"
3. Erase the previously selected soils from the basin layer


Basin soil with non prime farmland removed


The steps I tool to create the model included:
1.       Open ArcMAP
2.       Add basin.shp and soils.shp to the map via the Add Data tool or ArcCatalog
3.       Right click Mod2_jwilliams.tbx (previously created)
4.       Click on Model
5.       Drag the Basin and Soil layers into the Model window
6.       Open ArcToolbox
7.       Expand the Analysis Toolbox and the Extract tool set
8.       Click and drag the Clip tool to the Model window
9.       Click the Connect tool in the Model window
10.   Click on the soils layer and then click the clip tool
11.   Choose Input Feature
12.   Click on the basin layer and then click the clip tool again
13.   Choose Clip Feature
14.   The Clip tool and output feature class shapes will change to solid colors and the output feature class will be renamed to soils_clip.shp
15.   Right click the clip tool and run it – this will populate the output which is necessary for the next step
16.    Go back to the ArcToolbox
17.   Clip and drag the Select to the Model window
18.   Click the Connect tool
19.   Click on the soils_clip.shp  and then click the Select tool
20.   Double click the Select tool and configure the expression as "FARMLNDCL" = 'Not prime farmland'
21.   The Select  tool and output feature class shapes will change to solid colors and the output feature class will be renamed to soils_clip_select.shp
22.   Right click the select tool and run it – this will populate the output which is necessary for the next step
23.   Go back to the ArcToolbox
24.   Expand the Overlay toolset
25.   Click and drag the Erase tool to the Model window
26.   Click the Connect tool
27.   Click the Basin layer and then click the Erase tool
28.   Select Input Feature
29.   Click the  soils_clip_select.shp output and then click the Erase tool
30.   Select Erase Feature
31.   The Select  tool and output feature class shapes will change to solid colors and the output feature class will be renamed to soils_clip_select_erase.shp
32.  Right click the select tool and run it
33.  You can add the layers to the map from the Add Data tool or the ArcCatalog


Friday, May 23, 2014

Intro to Python

Welcome back!  For me, this is the final leg of my GIS Certification journey.  Programming is not something I have ever wanted to do, but over the years I have seen where knowing programming can be beneficial.  I know a little bit of HTML and some SQL and Access proramming, but at this point, that is the extent of my programming knowledge.  Python is an open source programming language that is supplied with ArcGIS.  The current version available with ArcGIS 10/10.1 is Python 2.7.  The textbook is telling me that it is easy to learn, we shall see.  Already I can see that Python is a very helpful language.  Say for example you begin to type a command that begins with the letter P.  Python will prompt you with a list of commands that begin with the P.

One thing I have learned in my brief programming experience has been the importance of syntax.  One missing or misplaced double quote can ruin your whole day.  Something I hope to gain from this course is a greater understanding of the roll scripting can play in GIS and how it can help me in my day to day use of ArcGIS.

Our first assignment was to open, examine and run a script that creates a module folder for each week of our GIS Programming course.  The results of the script can be seen in the image below.